- Demolition numbers outpaced buildings approved
- March 2021 quarter strongest for demolition approvals
- Building approvals were down 8.6% for April
The cryptic headline comes as data from the Australian Bureau of Statistics (ABS) shows the March 2021 quarter had a surge in building demolitions, and a fall in buildings approved for the month of April.
Building approvals down
ABS data was released today on total dwellings approved.
For the month of April, the seasonally adjusted estimate showed falls of 8.6%.

While the monthly change went down, the year on year change saw building approvals up by 39.2%.
Houses, however, saw a small positive movement, up 4.6%, but other buildings like apartments and townhouses were down 28.6%.

Values of buildings approved also saw a drop, total values were down more than $12 billion, or 22.6%.
| Value of building approved, by building type | |||
| Seasonally adjusted | |||
| $m | Monthly % change | ||
| New residential building | 7342.1 | -7.6 | |
| Alterations and additions to residential building | 1054.5 | -3.8 | |
| Total residential building | 8396.6 | -7.1 | |
| Non-residential building | 3848.1 | -43.2 | |
| Total building | 12244.8 | -22.6 | |
Source – ABS.
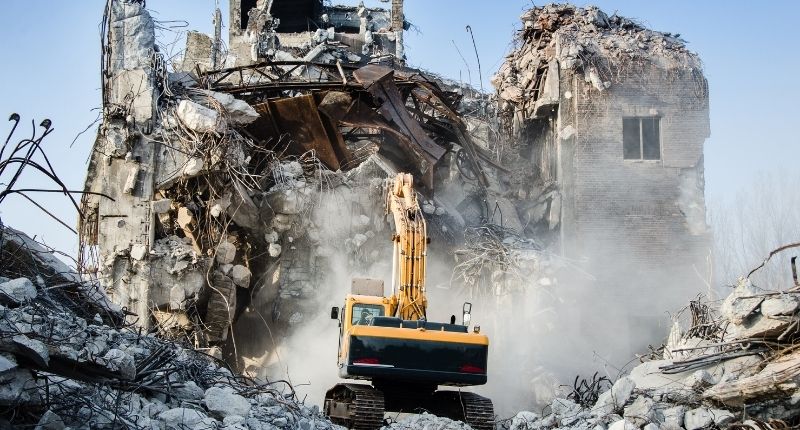
Building demolitions up
The ABS data showed that there were 107,294 dwellings that were approved for demolition in the five years to March 2021 quarter.
This quarter just passed saw the largest uptick in demolition activity, with 6,140 dwellings approved to be brought to the ground.

The vast majority of demolitions were houses (95.1%).
New South Wales was the state to have the most demolitions approved, 28,499.
| Types of dwellings approved to be demolished, June 2016 quarter to March 2021 quarter | |||
| State | Houses | Other residential | Total |
| New South Wales | 27,076 | 1,423 | 28,499 |
| Victoria | 35,979 | 1,123 | 37,102 |
| Queensland | 12,618 | 783 | 13,401 |
| South Australia | 11,969 | 596 | 12,565 |
| Western Australia | 11,478 | 721 | 12,199 |
| Tasmania | 417 | 73 | 490 |
| Northern Territory | 290 | 29 | 319 |
| Australian Capital Territory | 2,222 | 497 | 2,719 |
| Australia | 102,049 | 5,245 | 107,294 |
Source – ABS.
Demolitions generally sat equal with new dwelling approvals up until late 2018, when it continued to outpace new housing through to today.