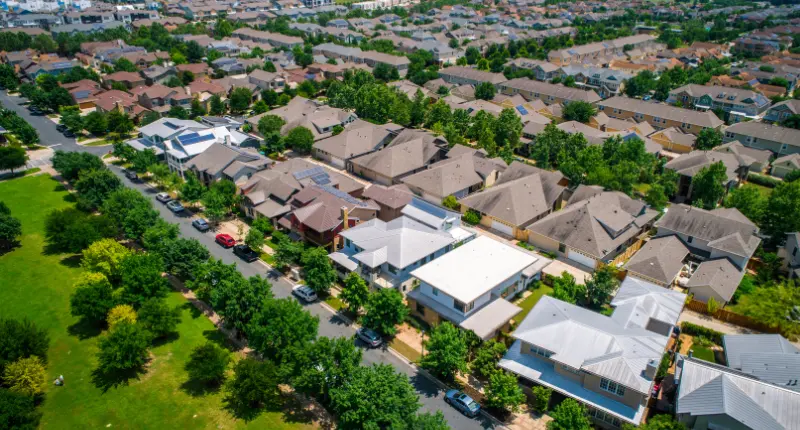
- Risk-prone properties cost owners more money.
- Banks, insurers and councils will make applications expensive.
- One in 25 Australian homes will be uninsurable by 2030.
Disaster-prone Australia
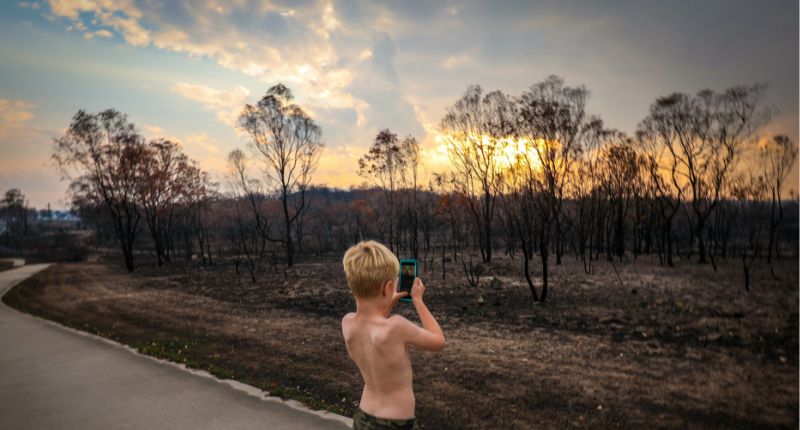
Our sunburnt country is a land of extremes, with a long history of bushfires, heatwaves, droughts and floods, heavy storms and tropical cyclones, as well as earthquakes, landslides and tsunamis.
The last decade has been increasingly damaging.
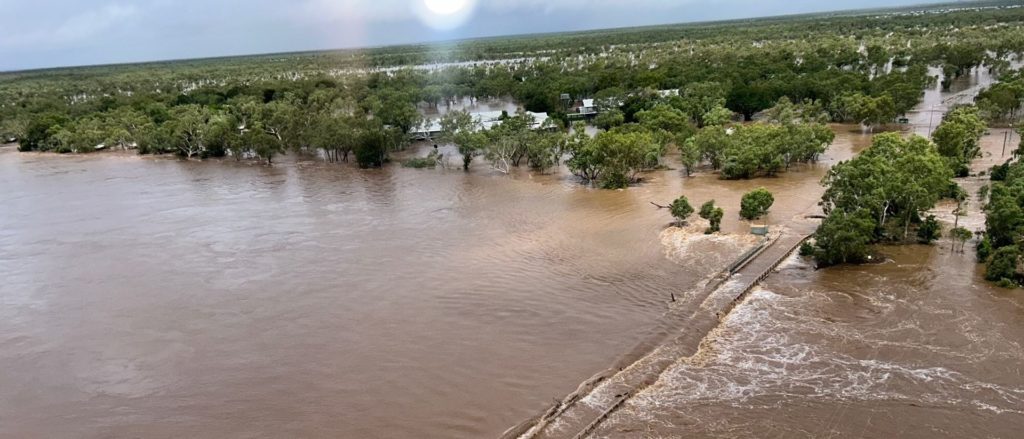
Analysis from the Australian Treasury shows that 68 per cent of Australians were living in an area that was covered by a natural disaster declaration in 2022, largely due to wet weather and floods across the east coast of the country.
In 2023, Australians have already seen the flow-on effects of earlier floods throughout the Murray-Darling basin, with towns in South Australia inundated.
Record flooding is also affecting the Kimberley region in Western Australia’s northwest and much of central Australia, as two meters of water left hundreds of homes damaged and many destroyed. Towns and communities face a massive rebuild through the Martuwarra – Fitzroy River.
Disasters cost money
Flooding in February and March 2022 became the single most expensive natural disaster in history, according to the Insurance Council, with more than $3.5 billion worth of claims paid out by insurers.
Treasury estimates the cost of the floods to the economy was around $5 billion, and the disasters also drove inflation by pushing up the cost of fruit and vegetables.
Your bottom line
Risk-prone properties also cost owners money in terms of more expensive insurance, bank loans and development approvals.
- Your local council will be reluctant to approve development plans and might add time and money-consuming red tape before approving your DA,
- Insurance premiums will be higher for risk-prone properties,
- Make sure to get quotes from multiple insurers before making a decision,
- Unfortunately, many flood-prone zones are not covered by property insurance, and
- Some banks won’t lend to bushfire-prone properties. Particularly developments in regional and forested areas.
Before you invest
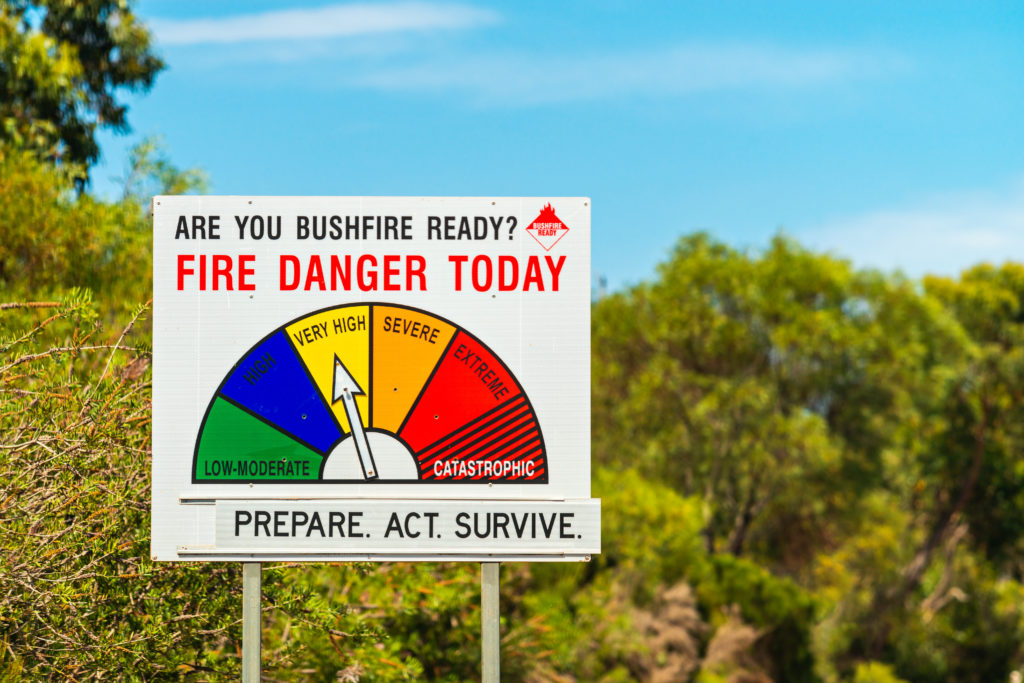
Before purchasing a property, you must research whether the area is vulnerable to environmental risks such as bushfires and floods.
Check your Contract of Sale’s zoning certificate (Section 10.7) to see whether the property is in a bushfire-prone zone.
Most local councils have publicly available flood maps which include historical data from previous flooding events along with flood risk modelling, and floodplain management reports online.
To further minimise insurance claims, look around the home itself. Check that trees aren’t hanging over your roof and at risk of damaging anything if they catch fire. Clean your gutters regularly and use flood-proof and fire-proof materials when building or renovating.
Is my home in a flood zone or high-risk area?
The Climate Risk Map is an interactive map that allows you to zoom into your suburb and see the percentage of properties that are at risk.
Adjust the settings to show low to high emissions scenarios, areas and hazards to see how the climate is impacting the homes in that suburb and if you live in a high-risk zone.
Source: Climate Council, Australia.
Uninsurable Homes
According to a 2022 report by the Climate Council, one in 25 Australian homes will be uninsurable by 2030. Whether you’re preparing to move this year or in the next five, awareness is key in decision-making. This is why using the mapping reference guides to determine the risks associated with your neighbourhood is crucial.
As per the report, these will be the 10 most at-risk suburbs by 2030.
- Nicholls, Victoria: 27% or 25,801 properties
- Richmond, New South Wales: 20% or 22,274 properties
- Maranoa, Queensland: 15% or 9,551 properties
- Moncrieff, Queensland: 14% or 18,032 properties
- Wright, Queensland: 14% or 12,140 properties
- Brisbane, Queensland: 13% or 19,355 properties
- Griffith, Queensland: 13% or 14,812 properties
- Indi, Victoria: 11% or 11,215 properties
- Page, New South Wales: 11% or 11,691 properties
- Hindmarsh, South Australia: 11% or 10,775 properties
~~
This article seeks to provide general information only. See our Terms of Use.