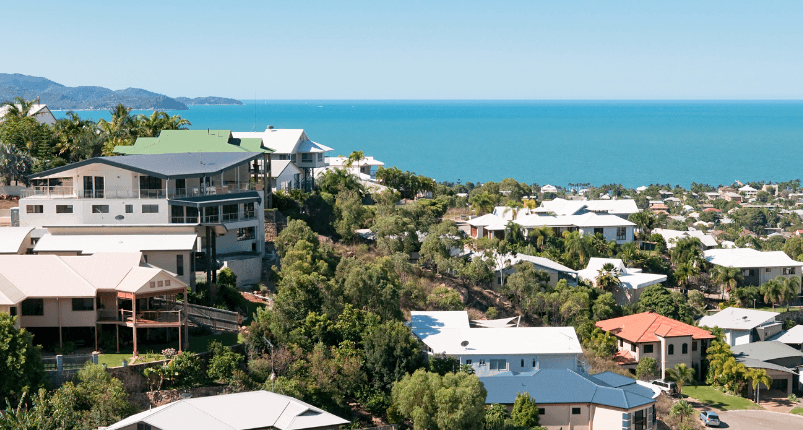
- Most suburbs in the top five located within approximately 20km of Sydney
- Most suburbs are generally well serviced by public transport, particularly trains
- Denistone takes top spot for the Professional Sydney category
Shore Financial has released its November report for Sydney property, ranking more than six hundred suburbs by the expected growth in asking prices over the next six months.
The company divided the categories up into quintiles, with the fourth quintile called Professional Sydney.
Shore Financial CEO Theo Chambers said the Shore Financial State of Sydney Report is a more timely assessment of the market:
“This quarterly report focuses on leading indicators, rather than lagging indicators, which means instead of talking about how prices have changed in the past, it forecasts how prices are likely to move in the next six months,” he said.
Mr Chambers added that: “All the top suburbs in this report have low inventory levels and low days on market. That means they’re strong seller’s markets, which means buyers have to compete hard to outbid other buyers. That, in turn, is likely to drive significant price growth in the near future.”
The top five
| Rank | Suburb | Postcode | LGA | Current median house price | Forecast house price growth for next 6 months |
| 1 | Denistone | 2114 | Ryde | $1,990,000 | 15.3% |
| 2 | Ashbury | 2193 | Inner West | $1,780,000 | 14.5% |
| 3 | Warriewood | 2102 | Northern Beaches | $2,120,000 | 12.7% |
| 4 | Monterey | 2217 | Bayside | $1,868,000 | 11.5% |
| 5 | Croydon Park | 2133 | Burwood | $1,756,000 | 7.8% |
Denistone
| Average household weekly income | $2,333 |
| Median house price – now | $1,990,000 |
| Median house price – growth over past 12 months | 9.30% |
| Median house price – forecast growth over next 6 months | 15.30% |
| Inventory levels | 1.1 months |
| Days on market | 25 days |
| Share of homes occupied by owner-occupiers | 82.80% |
| Share of homes that are freestanding houses | 83.30% |
Ashbury
| Average household weekly income | $2,157 |
| Median house price – now | $1,780,000 |
| Median house price – growth over past 12 months | 18.70% |
| Median house price – forecast growth over next 6 months | 14.50% |
| Inventory levels | Under 1 month |
| Days on market | 26 days |
| Share of homes occupied by owner-occupiers | 88.30% |
| Share of homes that are freestanding houses | 90.20% |
Warriewood
| Average household weekly income | $2,160 |
| Median house price – now | $2,120,000 |
| Median house price – growth over past 12 months | 28.50% |
| Median house price – forecast growth over next 6 months | 12.70% |
| Inventory levels | 1.1 months |
| Days on market | 19 days |
| Share of homes occupied by owner-occupiers | 81.50% |
| Share of homes that are freestanding houses | 48.90% |
Monterey
| Average household weekly income | $1,498 |
| Median house price – now | $1,868,000 |
| Median house price – growth over past 12 months | 19.70% |
| Median house price – forecast growth over next 6 months | 11.50% |
| Inventory levels | 2.6 months |
| Days on market | 26 days |
| Share of homes occupied by owner-occupiers | 68.30% |
| Share of homes that are freestanding houses | 42.20% |
Croydon Park
| Average household weekly income | $1,597 |
| Median house price – now | $1,756,000 |
| Median house price – growth over past 12 months | 30.60% |
| Median house price – forecast growth over next 6 months | 7.80% |
| Inventory levels | 1.8 months |
| Days on market | 27 days |
| Share of homes occupied by owner-occupiers | 67.10% |
| Share of homes that are freestanding houses | 45% |
The methodology
Shore Financial said each quintile is assigned based on the current median asking price for houses.
The top five are whittled down by excluding suburbs that don’t meet the company’s benchmarks and trends related to asking prices, days on market, inventory levels, and sales volumes over the previous three months.
The company then ranks the remainder by expected growth in asking prices over the next six months.
Shore Financial said the data comes from Suburbtrends, with data based on results over the 24 months to November 2021. Other information about average household weekly income, owner-occupier share, and freestanding house share comes from the 2016 census.


