- Non-residential approvals surge, residential declines
- Office assets drive planning activity increase
- Crane index reveals mixed construction results
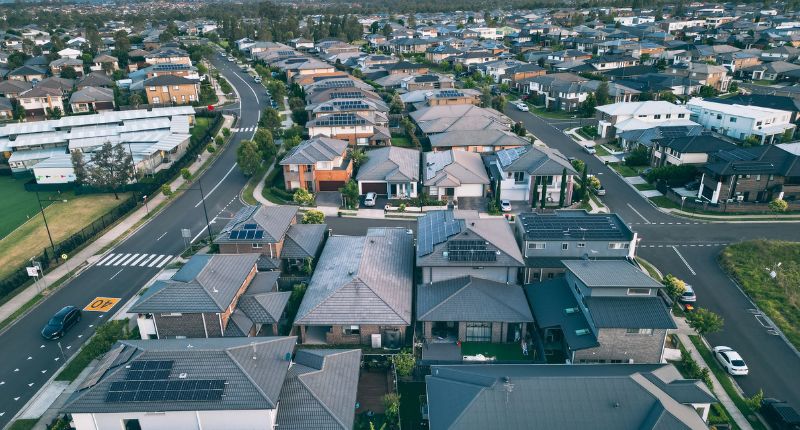
Despite residential building slowing down in the past 12 months, the value of commercial building approvals has been surging according to new data.
According to the Australian Bureau of Statistics (ABS), monthly non-residential building approvals grew at 39.8%, well ahead of the residential results which recorded a 7.7% improvement.
Over the past year, the value of residential approvals has declined 3.15% while the value of non-residential developments continues to grow, up 3.61% on the year to February 2023.
Mixed results
While commercial construction is increasing, the results are mixed across the country.
Victoria showed the greatest value of new development, increasing their approvals by 19.56% over the year, followed by New South Wales at 8.77%, and Queensland up 4.45%. South Australia, Australian Capital Territory and Western Australia saw approvals fall over the same period by 42.56%, 37.99%, and 2.91% respectively.
Head of research at Ray White Commercial, Vanessa Rader said the asset classes seeing the greatest volume of planning activity continue to sit with office assets.
“Despite the overall low occupancy across many office markets across the country, there has been a 25.69% increase in approvals this year,” Rader said.
“Industrial is less surprising given the overall limited vacancy in this asset class, seeing a 20.35% increase over the year to February 2023, dominated by warehouse developments.”
“Retail and healthcare assets continue to grow, up 5.28% and 4.29% respectively, while aged care has fallen 3.47%.”
Fewer cranes in the sky
While approvals are the starting point for many new projects, the recent RLB Crane Index looks at current construction activity by counting cranes on the Australian skyline which has recorded an overall dip across the country both for residential and commercial assets.
Data from Q1 2023 highlights 836 cranes currently across the Australian skyline; 293 were new additions while 325 were removed, resulting in a net loss of 32 over the last six months. Residential, however, continues to be the dominant asset class representing 63.6% of all cranes sitting relatively stable with only a three-crane loss.
Australian crane index

“Coastal markets such as Gold Coast, Sunshine Coast, Sydney’s Central Coast and Wollongong all recorded residential additions, together with Perth and Adelaide; while Brisbane, Melbourne and Sydney all have declined,” said Rader.
“Given the mismatch between demand and supply for the residential market, pressure on development will likely continue which may see these crane rates grow across the residential segment in the coming year. Across the commercial markets, there are some mixed results.”
Despite Melbourne’s strong approval pipeline, this region saw the greatest decrease in cranes over the last six months losing 17 as all asset types saw a reduction, signalling an end for some projects in the CBD and inner Melbourne Rader said.
“Over the last 12 months, Melbourne saw a net decline of nine non-residential cranes behind Perth who lost 10, notably in the education and healthcare sectors, while Brisbane results remain stable. Sydney’s annual growth has been off the back of infrastructure projects with civic, civil, education, and healthcare all recording new crane additions while commercial, data centers and hotels have declined.”
“While annually there has only been a net loss of two cranes across Australia, over the last six months, this grew to a -29 net change in non-residential cranes on our skyline. Given the strong approval pipeline these results could again rebound; however, high construction and financing costs may continue to dampen activity, particularly for those sectors such as office and retail, which have had reduced.”


