- Sydney was ranked 23rd in the world.
- Work from anywhere is a growing trend.
- Work-life balance was the most cited benefit to WFA.
Hybrid working has given rise to the trend of ‘workations’ and work from anywhere (WFA), with a sizeable portion of workers choosing to work from anywhere in the world or extending their holidays.
A new study from IWG has found that 88% of hybrid workers worked from anywhere last year, while almost three in five (57%) extended their holidays by working abroad.
The rise of hybrid working
A recent report by Flexible Workspace Australia (FWA) found that many businesses were attracted to the ‘hospitality model’ that flexible workspaces offered.
Growing demand for the format was driven by the value workers put on flexibility in their work environment, along with staff retention and work culture.
While traditional offices remain the mainstay of CBDs, flexible workspaces have gained momentum in various ways.
The Property Tribune previously reported that some landlords have warmed to the concept of flexible spaces, with CBRE’s head of office and capital markets research, Tom Broderick, previously telling TPT:
“Major landlords are seeing flexible space as a boost to the overall amenity of their buildings, allowing for spaces that they can use when they need additional short-term project spaces,” he said.
Top 25 global cities for workations
| Ranking | City | Total Score |
| 1 | Barcelona | 58.5 |
| 2 | Toronto | 58.5 |
| 3 | Beijing | 57.5 |
| 4 | Milan | 57 |
| 5 | New York | 56.5 |
| 6 | Rio de Janeiro | 55 |
| 7 | Amsterdam | 55 |
| 8 | Paris | 55 |
| 9 | Jakarta | 55 |
| 10 | Lisbon | 54.5 |
| 11 | Brussels | 54 |
| 12 | Budapest | 53.1 |
| 13 | Manila | 52.5 |
| 14 | LA | 52 |
| 15 | London | 51.5 |
| 16 | Buenos Aires | 51.5 |
| 17 | Warsaw | 51 |
| 18 | Mumbai | 50.5 |
| 19 | Berlin | 49 |
| 20 | Sofia | 48 |
| 21 | Singapore | 48 |
| 22 | Hong Kong | 47.5 |
| 23 | Sydney | 46.5 |
| 24 | Copenhagen | 45.5 |
| 25 | Tel Aviv | 44.5 |
| 26 | Dublin | 41.5 |
Source: IWG.
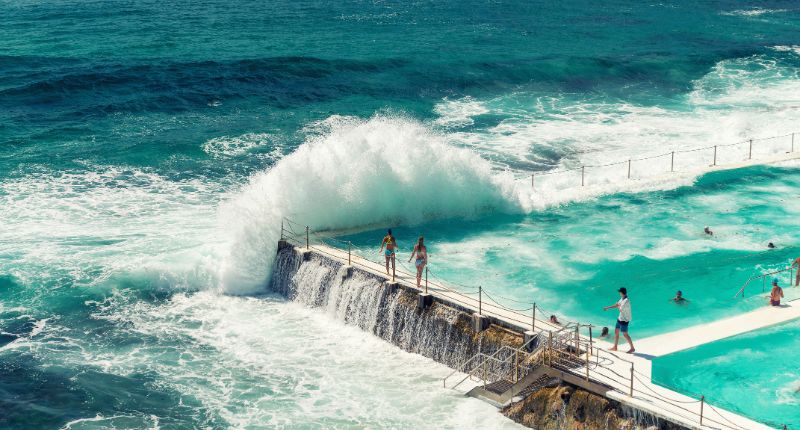
Sydney ranks among the best in the world
The Harbour City took out 23rd place, with strong scores for climate and happiness. It offers an enviable plethora of harbourside and beachside views paired with epicurean delights. Hybrid work travellers can enjoy all of this while also utilising one of IWG’s 19 centres in and around Sydney spread across the CBD and suburban areas.
“For an increasing number of workers, hybrid working offers the opportunity to work wherever we will be the most productive. And thanks to cloud technology, that can be anywhere in the world, provided there’s a high-quality internet connection available,” said IWG country head for Australia, Damien Sheehan.
“So, it’s no wonder that more and more individuals are embracing the idea of combining work with travel, whether it’s for a few days tacked on to the end of a vacation, or a few months as a digital nomad.
“This trend is set to accelerate further, and we will continue to see more and more companies embracing WFA policies to improve employees’ work-life balance and increase their attractiveness as an employer.”
IWG’s research found that over two in three workers (67%) believed that they could effectively perform their jobs abroad, and over seven out of ten (71%) said they would only consider a job that offers the flexibility to work remotely, at least part of the time.
Among the other highlights:
- Work-life balance was the most cited (76%) benefit of WFA,
- The ability to spend time with friends and family abroad (52%),
- Save money by travelling during off-peak periods (47%), and
- Enjoying longer holidays (30%).
Full details
| Ranking | City | Climate | Score | Culture | Score | Accommodation | Score | Transport | Score | Subsistence | Score | Broadband | Score | Food | Score | Happiness (based on happy city index) | Score | Availability of | Score | Total Score |
| (Total sunshire hours per year) | (Total number of galleries and museums) | (Average rent per month, $) | (Cost of monthly transport pass, $) | (Average price of a cup of coffee, $) | (Average cost of lunch, $) | Flexible workspaces (number of IWG office locations) | ||||||||||||||
| 1 | Barcelona | 2,530 | 7 | 511 | 5.5 | 1,158 | 8.5 | 43 | 9 | 2.68 | 8 | 189.71 | 7 | 12.96 | 4.5 | 1362,7 | 6 | 21 | 3 | 58.5 |
| 2 | Toronto | 2,071 | 5.5 | 509 | 5.5 | 1,769 | 7 | 116 | 6.5 | 3.55 | 6 | 167.77 | 6.5 | 10.53 | 5.5 | 1566,0 | 9 | 64 | 7 | 58.5 |
| 3 | Beijing | 2,505 | 7 | 1,484 | 10 | 1,204 | 8 | 42 | 8.5 | 4.57 | 4 | 260.14 | 7** | 9.64 | 6 | 1267,3 | 5 | 15 | 2 | 57.5 |
| 4 | Milan | 1,989 | 5.5 | 282 | 3 | 1,202 | 8 | 42 | 9 | 1.8 | 9.5 | 118.42 | 5 | 6.48 | 7.5 | 1405,1 | 6.5 | 28 | 3 | 57 |
| 5 | New York | 2,540 | 8 | 1,615 | 10 | 3,632 | 2 | 129 | 6 | 5 | 3 | 225.05 | 8.5 | 17.5 | 2 | 1602,0 | 10 | 70 | 7 | 56.5 |
| 6 | Rio de Janeiro | 2,193 | 6 | 346 | 3.5 | 768 | 9.5 | 53 | 8.5 | 1.54 | 10 | 122.7 | 5 | 8.43 | 6.5 | 1181,3 | 4 | 18 | 2 | 55 |
| 7 | Amsterdam | 1,670 | 4.5 | 177 | 2 | 1,789 | 7 | 99 | 7 | 3.69 | 6 | 113.04 | 4.5 | 5.4 | 8 | 1578,1 | 9 | 66 | 7 | 55 |
| 8 | Paris | 1,735 | 4.5 | 1,336 | 10 | 1,668 | 7 | 90 | 7 | 5.5 | 2 | 173.2 | 7 | 15.11 | 3 | 1514,9 | 7.5 | 69 | 7 | 55 |
| 9 | Jakarta | 2,973 | 8.5 | 65 | 1 | 526 | 10 | 10 | 10 | 2.23 | 9 | 33.07 | 2 | 2.95 | 9.5 | 1134,3 | 3 | 20 | 2 | 55 |
| 10 | Lisbon | 2,801 | 7.5 | 122 | 1.5 | 1,231 | 8 | 43 | 9 | 2.52 | 8 | 99.50 | 4 | 3.78 | 9 | 1233,1 | 5.5 | 16 | 2 | 54.5 |
| 11 | Brussels | 1,585 | 4 | 719 | 7.5 | 1,062 | 8.5 | 52 | 8.5 | 3.52 | 6 | 78.21 | 3.5 | 7.56 | 7 | 1359,2 | 6 | 28 | 3 | 54 |
| 12 | Budapest | 1,980 | 5.5 | 167 | 2 | 611 | 9.6 | 28 | 9.5 | 2.47 | 8.5 | 170.45 | 6.5 | 10.12 | 5.5 | 1190,8 | 4 | 15 | 2 | 53.1 |
| 13 | Manila | 2,110 | 6 | 50 | 1 | 553 | 10 | 10 | 10 | 3.02 | 7 | 94.16 | 4 | 4.26 | 8.5 | 5.81 | 3 | 22 | 3 | 52.5 |
| 14 | LA | 3,259 | 9.5 | 449 | 4.5 | 2,492 | 5 | 95 | 7 | 4.92 | 3.5 | 198.81 | 7.5 | 23 | 0 | 1554,5 | 8 | 63 | 7 | 52 |
| 15 | London | 1,659 | 3.5 | 670 | 7 | 2,247 | 5.5 | 207 | 3.5 | 3.7 | 6 | 89.93 | 4 | 13.91 | 4 | 1586,9 | 8 | 115 | 10 | 51.5 |
| 16 | Buenos Aires | 2,520 | 7 | 181 | 2 | 634 | 9.5 | 7 | 10 | 1.61 | 10 | 100.66 | 4.5 | 18 | 1.5 | 1202,6 | 6 | 5 | 1 | 51.5 |
| 17 | Warsaw | 1,595 | 4 | 166 | 2 | 916 | 8.5 | 26 | 9.5 | 2.94 | 7.5 | 147.14 | 6 | 9.47 | 6 | 1230,0 | 5.5 | 20 | 2 | 51 |
| 18 | Mumbai | 2,590 | 7.5 | 205 | 2.5 | 579 | 10 | 4 | 10 | 2.47 | 8.5 | 48.76 | 2.5 | 10.46 | 5.5 | 1125,1 | 2 | 15 | 2 | 50.5 |
| 19 | Berlin | 1,712 | 4.5 | 610 | 6.5 | 1,692 | 7 | 85 | 7.5 | 3.67 | 6 | 92.84 | 4 | 13.98 | 4 | 1548,2 | 7.5 | 16 | 2 | 49 |
| 20 | Sofia | 2,223 | 6.5 | 64 | 1 | 458 | 10 | 27 | 9.5 | 2.03 | 9 | 78.01 | 3.5 | 13.26 | 4 | 5.563 | 3.5 | 7 | 1 | 48 |
| 21 | Singapore | 2,032 | 5.5 | 278 | 3 | 3,562 | 2.5 | 95 | 7 | 4.87 | 3.5 | 242.01 | 9 | 10.43 | 5.5 | 1544,2 | 8 | 36 | 4 | 48 |
| 22 | Hong Kong | 1,825 | 5 | 165 | 2 | 2,916 | 4 | 64 | 8 | 5.7 | 2 | 205.19 | 8 | 6.51 | 7.5 | 1421,6 | 7 | 37 | 4 | 47.5 |
| 23 | Sydney | 2,600 | 8.5 | 249 | 2.5 | 1,745 | 7 | 145 | 5.5 | 3.06 | 6.5 | 54.21 | 2.5 | 16.95 | 2.5 | 1568,8 | 8.5 | 22 | 3 | 46.5 |
| 24 | Copenhagen | 1,635 | 4 | 127 | 1.5 | 1,730 | 7 | 82 | 7.5 | 6.3 | 1 | 218.87 | 8 | 8.64 | 6.5 | 1539,9 | 8 | 13 | 2 | 45.5 |
| 25 | Tel Aviv | 3,330 | 10 | 138 | 1.5 | 1,726 | 7 | 63 | 8 | 4.04 | 5 | 99.64 | 4 | 19 | 1 | 1322,1 | 6 | 14 | 2 | 44.5 |
| 26 | Dublin | 1,440 | 3.5 | 111 | 1.5 | 1,962 | 6.5 | 128 | 6 | 4.02 | 5 | 98.93 | 4 | 8.64 | 6.5 | 1448,8 | 6.5 | 12 | 2 | 41.5 |
Source: IWG.


