
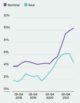
- Turkey took top spot, with 59% growth in nominal terms
- The Antipodes was well represented across nominal and real price growth
- Knight Frank's report found a divergence between the two metrics in the latest quarter
Over the past two years, we’ve continually heard ovations made about the strength of our residential market, indeed it could be argued to be continuous and not continual.
But how does the Australian market compare globally?
With house prices also moving at record rates across the ditch, one must, naturally, invoke a little, old Antipodean rivalry.
The world
In Knight Frank’s Global House Price index for Q4 2021, 56 countries and territories were ranked. Knight Frank’s index tracks nominal and real price growth in local currencies.
The report found that house prices rose 10.3% on average in 2021, globally. That is of course referring to the 56 countries on the index, as previously mentioned.
Knight Frank’s index also found that nominal and real price growth was the polar opposite of being in lockstep with each other, contrasting the trend that seemed to develop throughout 2020.
Global house prices by annual percentage change
The moderation of real price growth was notable, the report said “This is the first time we have witnessed a slowing rate of annual growth since the start of the pandemic.”
As for the remainder of this year, it will continue to be a mixed bag: the report noted that on the one hand, the situation in Ukraine may put the brakes on global economic growth, but on the other, the number and speed of interest rate hikes could be reduced.
Highest annual price growth: Turkey
In nominal terms, Turkey takes the top spot for the quarter, prices climbed 59% in 2021.
Still considering nominal price growth, New Zealand took second place.
| Country/Territory | Nominal price growth |
| Turkey | 59.6% |
| New Zealand | 22.6% |
| Czech Republic | 22.1% |
| Slovakia | 22.1% |
| Australia | 21.8% |
| Netherlands | 20.3% |
| United States of America | 18.8% |
| South Korea | 18.4% |
| Jersey | 18.4% |
| Estonia | 17.3% |
Source: Knight Frank Research.
After considering the country’s inflation of 36% at the end of 2021, and 54% by the end of February this year, number one no longer belongs to Turkey, instead, going to the home of the world’s best cricketers.
Highest annual price growth in real terms
For better or for worse, Australia takes the top spot for the quarter, recording 17.5% of price growth in real terms.
Notably, the report said the top five performers for both nominal and real price changes were the same, only differing in order.
| Country/Territory | Real price growth |
| Australia | 17.5% |
| Turkey | 17.3% |
| Czech Republic | 16.4% |
| New Zealand | 15.7% |
| Slovakia | 15.4% |
| South Korea | 14.2% |
| Jersey | 14.1% |
| Netherlands | 13.8% |
| Sweden | 11.7% |
| United States of America | 11.0% |
Source: Knight Frank Research.
Declines were recorded, however, in the three M’s: Malaysia (-0.7%), Malta (-3.1%), and Morocco (-6.3%), these being in nominal terms.
In real terms, declines were recorded as follows:
| Country/Territory | Real price declines |
| Morocco | -7.4% |
| Brazil | -4.3% |
| India | -3.4% |
| Cyprus | -2.8% |
| Malaysia | -2.8% |
| South Africa | -2.3% |
| Spain | -2.0% |
| Lithuania | -1.0% |
| Indonesia | -0.4% |
Source: Knight Frank Research.
Finally, the report noted that the top ten markets for price increases since the beginning of the pandemic were typically “largely developed markets where governments stepped in to support economies, and in some cases, housing markets via mortgage holidays or subsidy programmes.”
Strongest increase in house prices since beginning of the pandemic