- After an eight-month decline, Sydney rent prices have been on the rise since November 2020
- 3-bed house rentals are back to February 2020 levels at $1,460/week
- All houses and unit rental prices are also rising
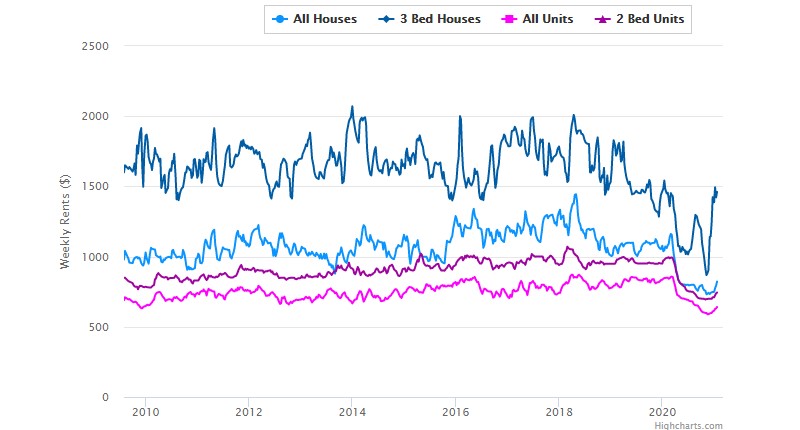
As shown in the main chart (above) rental prices across Sydney were relatively stable for five years post 2010, with a slight uptick through 2017 and 2018, only to see them pare back again through 2019.
The Covid shock of March 2020 led to a five month decline in rents, in all categories, but early signs suggest that the rental market is on the rise since the various property types hit rock bottom in November 2020:
- 3-bed houses were going for $882/week (down from $1,224 in February 2020);
- All houses were down to $732 (from $1,160);
- 2-bed units had fallen o $694 (from $990); and
- All units had declined to $599 (from $854)
In each category, rents were down around 50% over less than half a year, having risen perhaps 5% or so over the previous decade.
Since November however, things have been on the up. The relative easing of Covid restrictions, improving economy and jobs market has seen Sydney rents rise 75% for 3-bedroom houses, and around +20% on all other property categories.
Vacancy rates
A leading indicator of which way the rental market is going can be ‘vacancy rates’ – the percentage of empty rental properties as compared to the total number of properties.

As seen from the chart above, vacancy rates peaked in Sydney just after the global financial crisis of 2008 at 7.1% (July 2009). They then declined steadily to 1.7% in March 2017.
Vacancies had been on an increase since then, peaking in June 2019 at 8.1% before falling back to around 4%.
The sudden increase in vacancy rates can be seen in mid-2020 can be seen in perspective, as it rose sharply from 4.6% in February to 16.2% in May.
Vacancies have since fallen back to 7.8% (December 2020); a trend also picked up by Real Estate Institute of NSW data.
Falling supply and rising prices are often related to the same thing – increasing demand. The rental market seems to be on the move in Australia’s largest city.
~~
Source: SQM Research interactive charts. Used, with permission.
Before making a property decision, please do your own independent research, taking into account your own personal financial situation. This article does not purport to provide financial advice. See our Terms of Use.


