- Significant stock was added to the Sydney and Melbourne office markets during Q4
- Stronger demand is expected throughout 2022 as employees return to the office
- Potential new Covid variants might disrupt the demand for office assets, the report warns
The COVID-19 pandemic caused a short sharp recession in Australia early in 2020, however the Australian economy returned to growth in the second half of that year and into the first half of 2021.
However, the COVID-19 induced lockdowns across New South Wales, Victoria, and the Australian Capital Territory interrupted the recovery from the 2020 recession, with data to September 2021 showing that the national economy contracted 1.9% in Q3 after expanding 0.7% in Q2 ad 1.8% in Q1.
As target vaccination rates of the population were progressively achieved in 2H 2021, substantial easing of restrictions begun, and the engine room state economies began to recover.
NSW returned a positive State demand result first in Q2, and Victoria in Q3 at an impressive 4.5%.
As Australia’s economic growth rates improve, so too are the proportions of that growth contributed by our two largest States.
Deloitte Access Economics expects a positive forecast of real gross state product for Victoria in the calendar years of 2022 and 2023 at least, in excess of the 10-year average of 2.0% pa. COVID-19’s new Omicron variant poses some threat to that continued growth given the significantly increased contagion aspect over Delta.
Cushman & Wakefield’s 4Q 2021 report highlights the demand and supply recovery of the two largest office markets in Australia.
Supply and Demand – Melbourne
After 351,900 square metres (sqm) of stock was added in 2020 and 65,500sqm was withdrawn, the first six months of 2021 saw a mere 13,200sqm added and 13,500sqm withdrawn.
Almost another 190,000 sqm of new and refurbished space, however, was completed prior to the end of the year, two thirds of which, is pre-commited.
A further 139,000sqm is due for delivery in 2022.
In terms of current and future demand, business confidence is stronger, but cautious. Local businesses are making decisions on three – and five-year terms. Larger tenants are slower to commit with many opting for short term extensions.
Stronger levels of demand are expected in 2022 as the economy and jobs growth continue to recover, however, this may be limited by new COVID-19 variants.
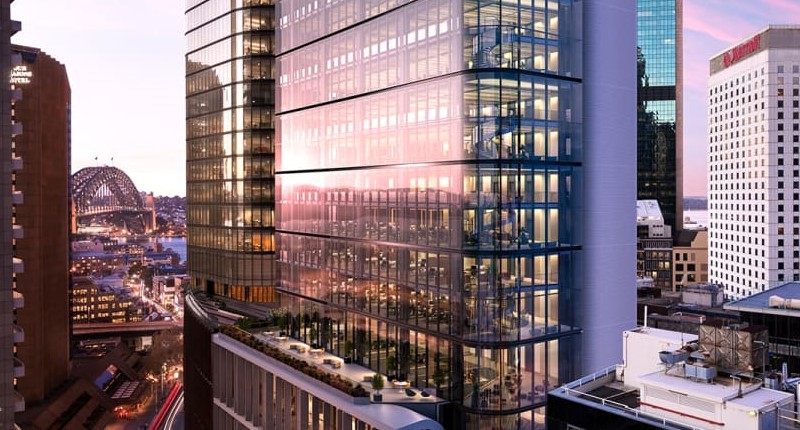
Supply and Demand – Sydney
Slightly more than 150,000 square metre (sqm) of new and refurbished space is anticipated to come online in the Sydney CBD over 2022.
This includes the newly constructed Wynyard Place (68,808sqm) as well as over 80,000 in refurbished space.
Pending pre-commitment, the potential exists for over 1,000,000sqm of supply to enter the CBD market over the next eight years.
In addition to Wynyard Place, notable premium grade towers currently underway include Salesforce Tower (54,000sqm with 50% pre-committed) and Quay Quarter Tower (88,000sqm with 87% pre-committed) are due to complete in 2022.
Following to the latest lockdown, a range of office tenant demand indicators including financial markets and employment are turning positive. Business confidence was positive following lockdown but more recently has been tempered by the spread of Omicron variant.
Anecdotally, Cushman & Wakefield’s office leasing team reports solid enquiry in Q4, though some larger tenants continue to reassessing their space needs due to ongoing social distancing requirements and the rise in flexible working, dampening the impact of the improved economy on tenant demand.
Rents – Melbourne

Net incentives stablished in Q4 2021.
The consolidation of incentives is reflective of a market that has seen a welcomed increase in the number of enquiries, but still has a variety of tenant options available across quality office accommodation.
As the recovery gathers pace in Australia’s two biggest States hit hardest by COVID-19, their return to greater proportions of our economy should also be reflected in workers returning to the CBDs.
Premium grade net incentives are 39% for the third consecutive quarter.
Average A-grade net incentives has incentives have also remained stable this year, at 41%.
Although stable, these levels remain 11%-12% higher year-on-year (YoY).
Currently, B-grade net incentives are 40%, stabilising too after 11% YoY growth.
Rents – Sydney
Leasing activity remained solid and rents generally stable in Q4 2021.
The average Prime grade incentive remains at 35% and gross face rents continue to average $1,355sqm per annum (pa).
Premium, A-grade, and B-grade gross face rents averaging $1,495, $1,280, and $1,030 respectively.
Across the grades gross incentives ranged from 30% to 39%, generally higher in the lower grades or where lease terms were longer.
As a result of the stable market, prime gross effective rents in the Sydney CBD were unchanged, ranging from $760 to $1,000sqm pa with an average, though are still down 4.7% year-on-year (YoY).
Melbourne – Market statistics
| Submarket | Investor | Vacancy Rate | Under Construction | Net effective rent
(A$/SQM/YR) |
Net effective rent
(US$/SQM/YR) |
Net effective rent
(EUR/SQM/YR) |
| Premium | 1,058,245 | 7.5% | 138,000 | 419 | 302 | 264 |
| A-grade | 2,366,226 | 11.7% | 354,002 | 373 | 269 | 236 |
| Prime* | 3,424,472 | 10.4% | 492,002 | 387 | 278 | 244 |
| B-Grade | 1,051,983 | 12.0% | 10,500 | 328 | 236 | 207 |
Sydney
| Submarket | Investor | Vacancy Rate | Under Construction | Net effective rent
(A$/SQM/YR) |
Net effective rent
(US$/SQM/YR) |
Net effective rent
(EUR/SQM/YR) |
| Premium | 1,270,203 | 5.5% | 142,000 | 980 | 705 | 615 |
| A-grade | 1,914,535 | 11.3% | 73,000 | 830 | 600 | 525 |
| Prime* | 3,184,738 | 9.0% | 215,000 | 885 | 635 | 555 |
| B-Grade | 1,342,405 | 904% | 0 | 670 | 480 | 420 |
Melbourne – Key leasing transactions
| Property | Submarket | Tenant | Lease SQM | Lease type |
| 567 Collins Street | CBD | WSP | 6,096 | Sublease |
| 628 Bourke Street | CBD | CPB Contractors | 3,730 | Direct |
| 555 Collins Street | CBD | Aware Super | 8,000 | Pre-commitment |
| 505 Little Collins Street | CBD | ARQ | 1,504 | Direct |
Sydney – Key leasing transactions
| Property | Submarket | Tenant | Lease SQM | Lease type |
| 570 George Streets | Midtown | College of Law Ltd | 5,438 | Direct |
| 255 George Street | Core | Australian Tax Office | 13,077 | Direct |
| 180 George Street | Core | The Executive Centre | 2,121 | Direct |
| 180 Gorge Street | Core | Jones Iang LaSalle Pty Ltd | 3,532 | Direct |
Melbourne – Significant projects under construction
| Property | Submarket | Tenant | Lease SQM | Lease type |
| 405 Bourke Street | Western Core | Nab | 66,000 | Q4 2021 |
| 99 Franklin Street | Flagstaff | n/a | 10,500 | Q4 2021 |
| 1000 La Trobe Street | Docklands | Myer | 39,546 | Q4 2021 |
| 100 Queen Street | Western Core | Robert Walters, Afterpay, Arcadis | 30,503 | Q4 2021 |
| 750 Collins Street | Docklands | Monash University | 38,933 | A4 2021 |
| 370 Little Lonsdale Street | Flagstaff | Victoria University | 24,000 | Q1 2022 |
| 555 Collins Street | Western Core | Amazon | 48,000 | Q1 2023 |
Sydney – Significant projects under construction
| Property | Submarket | Tenant | Lease SQM | Lease type |
| Salesforce Tower, 180 George Street | Core | Salesforce | 54,000 | Q3 2022 |
| Quay Quarter Tower, 50 Bridge Street | Core | AMP, Deloitte, Corrs | 88,274 | Q2 2022 |
| Poly Centre, 210 George Street | Core | 16,567 | Q2 2022 | |
| 32-36 York Street | Midtown | 8,342 | Q1 2023 |