- 79% of people in Greater Brisbane live in populated suburbs with total tree cover greater than 20%
- The new data gives local governments and others information and tools to create more resilient and sustainable communities
- “Research shows the more greenery a residential area has, the better it is for the physical and mental health of the local community."
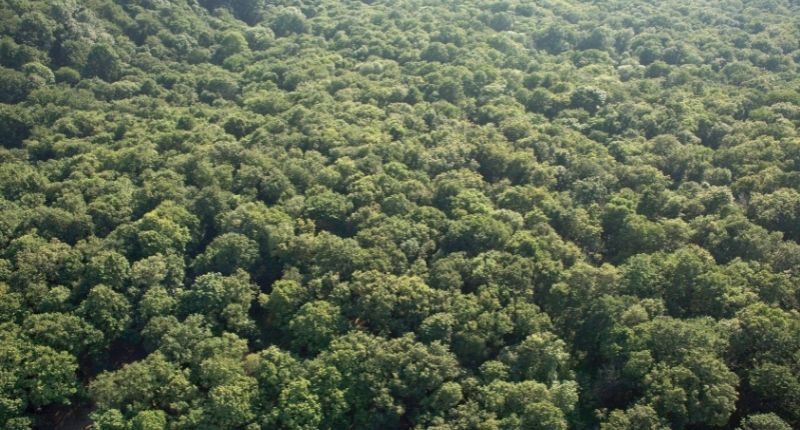
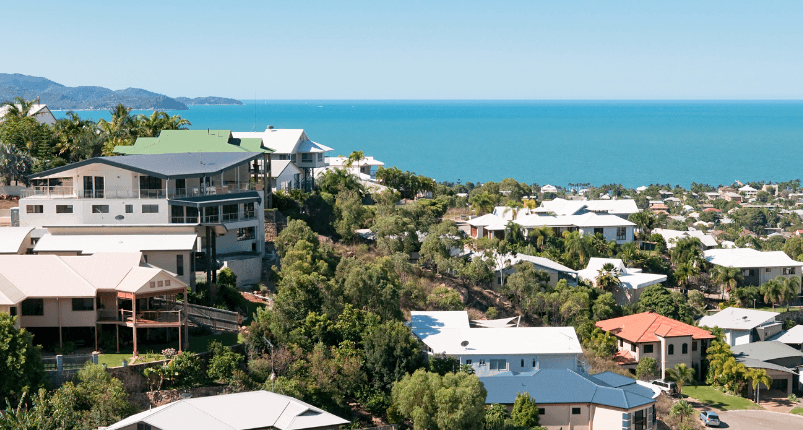
Brisbane has topped the ranking of Australia’s leafiest cities, according to research by Australian aerial imagery and location intelligence company Nearmap.
The research is the first and only of its kind, using a nationally consistent, high-resolution data set to compare total tree cover across all Australian cities.
Nearmap managing director and CEO Dr Rob Newman said, “The consistency and national coverage of the data for the first time provides a powerful picture of the density of urban forests, property development, and population distribution across the nation today.
“By revealing the major cities that are successfully creating green spaces – and which ones may need additional focus or investment – we can give local governments and other organisations the information and tools they need to create more resilient and sustainable communities.”
Dr Rob Newman, Nearmap managing director and CEO
It found 79% of people in Greater Brisbane live in populated suburbs with total tree cover greater than 20%.
Hobart is a close second with 71% of people living in areas with over 20% tree cover, followed by Darwin at 66%, the ACT at 58%, and Greater Sydney at 44%.
Keeping cool and shade
Locations with a lower percentage of tree cover in Melbourne, Adelaide, and Perth could see residents competing for shade as summer approaches, according to Nearmap.
Only 30% of people in Greater Melbourne live in suburbs with more than 20% tree cover, and this drops even further to 26% of people in Adelaide, and 22% of people in Perth.
Nearmap said, for residents in areas with lower tree coverage, the impacts are clear. Removing tree canopy can lead to the creation of urban heat islands, and has been shown to make cities 4-10 degrees hotter than surrounding areas. Trees and vegetation can also improve local water quality through reduced stormwater runoff and pollutants entering waterways. It also influences how ‘liveable’ an area is perceived.
According to a separate study, the 2021 Liveability Census by Place Score, one of the key things residents look for in an ‘ideal’ suburb is healthy vegetation and green spaces.
Dr Newman said, “This national data can also inspire urban planners in locations that are less leafy.”

Leafiest residential areas
The analysis led by Nearmap senior director of artificial intelligence systems Dr Michael Bewley revealed the leafiest residential areas in each region across Australia’s capital cities.
University of Western Australia’s environmental geographer and associate professor Dr Bryan Boruff said, “Research shows the more greenery a residential area has, the better it is for the physical and mental health of the local community. Increasing vegetation in our cities is very doable. While we are seeing some positive changes, such as local governments committing to increases in tree canopy, there is still more that we can do.
“Increasing the number of trees in a local suburb might seem trivial. But the impact – in terms of health, liveability, and wellbeing – on local communities can be significant, and evolves over time.”
University of Western Australia’s environmental geographer and associate professor Dr Bryan Boruff
Dr Newman said, “Australia is one of the world’s most urbanised nations, and international and domestic migration have spurred rapid growth in our capital cities and urban centres. Today’s urban planners, designers, councils, and government organisations need reliable, up-to-date, and detailed information to help them make informed decisions, and better plan and build the cities of the future.”

Capital City Breakdown: Leafiest suburbs by local region
Brisbane
| Region | Top suburb in region | Percentage tree cover |
| Brisbane – East | Sheldon | 66% |
| Brisbane – North | Shorncliffe | 23% |
| Brisbane – South | Burbank | 55% |
| Brisbane – West | Pullenvale | 52% |
| Brisbane Inner City | Bardon | 34% |
| Ipswich | Mount Crosby | 60% |
| Logan – Beaudesert | Buccan | 43% |
| Moreton Bay – North | Wamuran | 31% |
| Moreton Bay – South | Bunya | 53% |
Hobart
| Region | Top suburb in region | Percentage tree cover |
| Hobart | Sandford | 39% |
Darwin
| Region | Top suburb in region | Percentage tree cover |
| Darwin | Virginia | 44% |
Australian Capital Territory
| Region | Top suburb in region | Percentage tree cover |
| Australian Capital Territory | Aranda | 35% |
Sydney
| Region | Top suburb in region | Percentage tree cover |
| Central Coast | Jilliby | 52% |
| Sydney – Baulkham Hills and Hawkesbury | Annangrove | 56% |
| Sydney – Blacktown | Kings Park | 19% |
| Sydney – City and Inner South | Daceyville | 34% |
| Sydney – Eastern Suburbs | Double Bay | 33% |
| Sydney – Inner South West | Lugarno | 29% |
| Sydney – Inner West | Liberty Grove | 24% |
| Sydney – North Sydney and Hornsby | Wahroonga | 43% |
| Sydney – Northern Beaches | Church Point | 53% |
| Sydney – Outer South West | Douglas Park | 32% |
| Sydney – Outer West and Blue Mountains | Warrimoo | 62% |
| Sydney – Parramatta | Newington | 32% |
| Sydney – Ryde | Cheltenham | 44% |
| Sydney – South West | Voyager Point | 18% |
| Sydney – Sutherland | Grays Point | 43% |
Melbourne
| Region | Top suburb in region | Percentage tree cover |
| Melbourne – Inner | Toorak | 24% |
| Melbourne – Inner East | Blackburn | 28% |
| Melbourne – Inner South | Beaumaris | 23% |
| Melbourne – North East | North Warrandyte | 64% |
| Melbourne – North West | Mount Macedon | 60% |
| Melbourne – Outer East | Olinda | 71% |
| Melbourne – South East | Emerald | 53% |
| Melbourne – West | Seddon | 13% |
| Mornington Peninsula | Hmas Cerberus | 44% |
Adelaide
| Region | Top suburb in region | Percentage tree cover |
| Adelaide – Central and Hills | Crafers West | 63% |
| Adelaide – North | Banksia Park | 29% |
| Adelaide – South | Belair | 46% |
| Adelaide – West | Mile End | 16% |
Perth
| Region | Top suburb in region | Percentage tree cover |
| Mandurah | Furnissdale | 32% |
| Perth – Inner | Shenton Park | 27% |
| Perth – North East | Glen Forrest | 50% |
| Perth – North West | Gnangara | 22% |
| Perth – South East | Roleystone | 48% |
| Perth – South West | Casuarina | 34% |
Source: Nearmap, 2021


