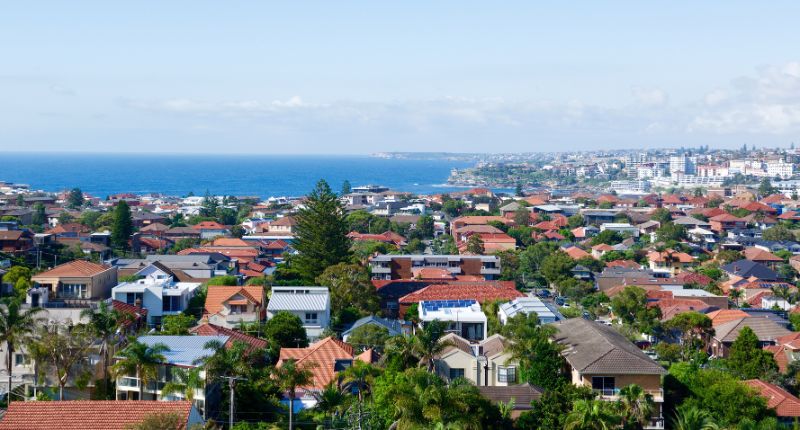
- Australia's regions welcomed some 70,900 people
- Capital city populations declined by 26,000, with the largest exodus from Melbourne
- Regional NSW had the largest population growth
The Australian Bureau of Statistics (ABS) has released its latest population growth figures and the numbers tell quite the story.
The population of regional Australia grew by 70,900 people during 2020-2021 and the population of capital cities declined by 26,000. This makes it thirty years since Australia last saw such a trend:
“This is the first time since 1981 that Australia’s regional population grew more than the capital cities, due to changing migration patterns during the pandemic.”
ABS Director of Demography Beidar Cho
“Regional New South Wales (up 26,800) and regional Queensland (24,100) led the way in terms of population growth over 2020-21, with regional Victoria (15,700) also increasing,” said ABS Director of Demography Beidar Cho.
Population change, regional Australia
| Regional | Change 2020-21 | Population 30 June 2021 |
| New South Wales | 26,800 | 2,827,200 |
| Victoria | 15,700 | 1,552,800 |
| Queensland | 24,100 | 2,639,200 |
| South Australia | 1,200 | 395,000 |
| Western Australia | 1,900 | 540,400 |
| Tasmania | 1,100 | 302,900 |
| Northern Territory | 0 | 98,900 |
| Regional Australia | 70,900 | 8,361,200 |
Source: ABS.
Across the major capital cities, Melbourne saw the largest drop in population, with 60,500 leaving the coffee capital of Australia.
The ABS noted that: “… the overall decrease of 26,000 reflects increases in four capital cities (Brisbane, Perth, Adelaide and Canberra) offset by declines in the other four. This is the first overall population decline for the capitals ever recorded by the ABS.”
Population change, capital cities
| Capital city | Change 2020-21 | Population 30 June 2021 |
| Sydney | -5,200 | 5,361,500 |
| Melbourne | -60,500 | 5,096,300 |
| Brisbane | 21,900 | 2,582,000 |
| Adelaide | 1,900 | 1,378,400 |
| Perth | 16,200 | 2,141,800 |
| Hobart | -330 | 238,400 |
| Darwin | -330 | 147,000 |
| Canberra | 400 | 431,600 |
| All capitals | -26,000 | 17,377,000 |
Source: ABS.
The market reacts?
Note: The following charts from SQM could only be filtered down to postcodes and not individual suburbs, and the hyphenated areas in the table below are not necessarily all the same postcodes.
In New South Wales, Riverstone – Marsden Park (2765) was the area to see the largest increase in population over the 2020-2021 period.
It’s interesting to see that house prices were floating around $750,000 for some time, before increasing steadily throughout the pandemic.
Asking house prices, 2765
Compare that to Sydney (2000), which saw prices jump around in a spritely manner. Sydney (2000) also includes Haymarket and The Rocks.
Asking house prices, 2000
Stock on market for 2765 also gradually increased towards the end of 2020, before dropping off dramatically.
Stock on market, 2765
Victoria’s Cranbourne East (3977) had the largest increase in population, and similar to Riverstone and Marsden Park, saw a steady rise in prices.
Asking house prices, 3977
Of the other suburbs with four-digit population growth, Queensland’s Pimpama saw 2,800 newly minted residents.
Asking house prices, 4209
Would you like a house there? While there are still some 500 properties on sale, stock is disappearing.
Stock on market, 4209
South Australia’s Munno Para West (5115) -Angle Vale (5117) area saw 1,100 people move there.
Asking house prices, 5115
Finally, Ellenbrook in Western Australia welcomed 1,700 people into the suburb during the pandemic. While house prices did rise, it was only by some $20,000.
Asking house prices, 6069
| State/Territory | Area with largest increase | Change 2020-21 | Population 30 June 2021 | Area with largest decrease | Change 2020-21 | Population 30 June 2021 |
| New South Wales | Riverstone – Marsden Park | 7,400 | 48,000 | Sydney – Haymarket – The Rocks | -1,700 | 31,500 |
| Victoria | Cranbourne East | 5,000 | 60,500 | Melbourne | -5,900 | 47,200 |
| Queensland | Pimpama | 2,800 | 24,900 | St Lucia | -770 | 13,800 |
| South Australia | Munno Para West – Angle Vale | 1,100 | 16,700 | Unley – Parkside | -390 | 20,700 |
| Western Australia | Ellenbrook | 1,700 | 47,700 | Nedlands – Dalkeith – Crawley | -390 | 19,300 |
| Tasmania | Rokeby | 310 | 7,300 | Sandy Bay | -430 | 12,500 |
| Northern Territory | Palmerston – South | 670 | 7,200 | Brinkin – Nakara | -190 | 3,200 |
| Australian Capital Territory | Denman Prospect | 780 | 1,700 | Civic | -270 | 4,600 |
Source: ABS.


