- The number of cranes above Australian cities has lifted for first time in two years
- Sydney and Melbourne have almost 70% of all cranes
- The Gold Coast has almost as many as Perth
In a further sign of the development and construction boom, the number of cranes adorning Australian city skylines rose to 691 in the latest Rider Levett Bucknall’s report, the first increase in two years.
Overall, there was a net gain of 16 new cranes from 675 (+2.3%), although this is still below the peak level of 757 in 2019.
Cranes in Sydney fell for a fourth straight year, slipping by a net 11 cranes to 286.
Sydney’s total of residential cranes is now at its lowest since late 2015. Even so, Sydney has more than 41% of all cranes across the capital cities, while accounting for 20% of the Australian population.
In a heart-warming Property Tribune story last week, a construction company asked students in a local day centre in Sydney’s inner west to name their nearby crane, with 11-year old Conor winning the competition.
Melbourne’s total increased by a net 16 to 193 from a year earlier. Melbourne now has 28% of all cranes, so together with Sydney, the two largest cities account for 69% of all cranes in the skylines.
It was Melbourne’s first increase in crane numbers in two years.
Cranes, by city, Q3 2020
| Q3, 2020 | % | Q1, 2021 | % | |
| Sydney | 297 | 44.0% | 286 | 41.4% |
| Melbourne | 177 | 26.2% | 193 | 27.9% |
| Brisbane | 50 | 7.4% | 71 | 10.3% |
| Perth | 36 | 5.3% | 30 | 4.3% |
| Gold Coast | 34 | 5.0% | 29 | 4.2% |
| Canberra | 27 | 4.0% | 26 | 3.8% |
| Sunshine | 15 | 2.2% | 16 | 2.3% |
| Wollongong | 13 | 1.6% | 12 | 1.7% |
| Adelaide | 10 | 1.5% | 10 | 1.4% |
| Central Coast | 5 | 0.7% | 9 | 1.3% |
| Newcastle | 13 | 1.9% | 9 | 1.3% |
Source: Rider Levett Bucknall
A net gain of 21 cranes in Brisbane has lifted its total to 71, its highest in two-and-a-half years.
Meanwhile, Perth’s total number of cranes fell by six to 30, reflecting fewer commercial and educational projects.
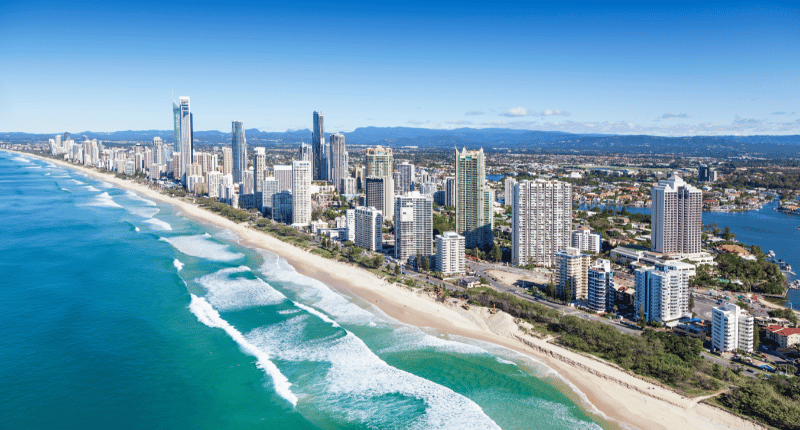
With the apartment property building boom in full swing, the Gold Coast has almost as many cranes in the sky as the West Australian capital, with 29. Canberra is also developing apace with 26 cranes.
At the bottom of the table sit Darwin and Hobart, with no cranes counted at all, and Adelaide holding steady with ten.
In terms of sectors, almost 60% of all cranes across the capital cities and regional areas are for use in residential projects (409), with a big drop off to mixed-use (80) and commercial (67).


