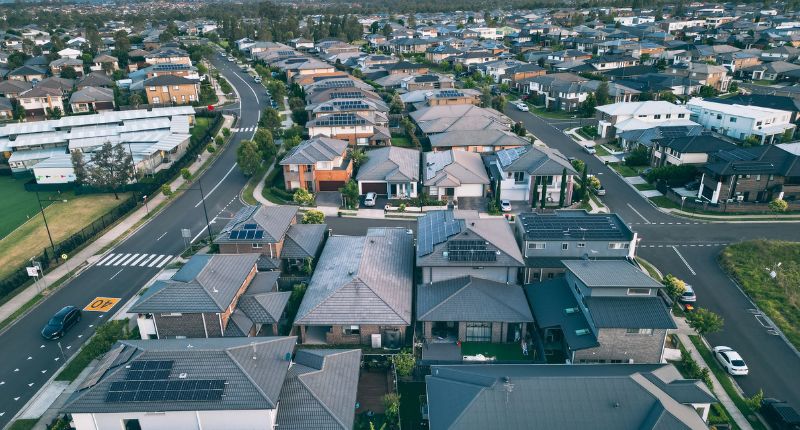
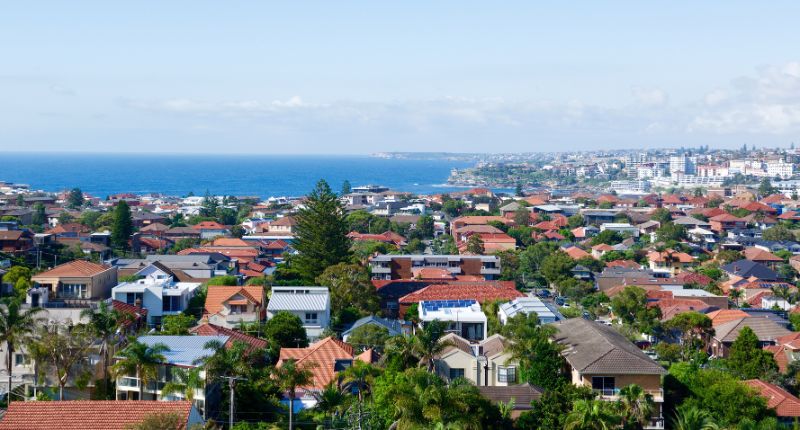
- Recession worries have subsided for some, lifting Sydney's inner city markets.
- Growth was recorded across the full spectrum from high-end to affordable locations.
- Median prices expected to continue growing, as consumer confidence strengthens.
Australia’s property prices rose 2.3% across the first half of this year, with Sydney leading the pack. Some of the Harbour City’s most desirable locales recorded strong levels of growth, with affordable locations across the country also seeing prices scampering upwards.
PropTrack data has revealed the top 10 suburbs that recorded the largest six-month median Automated Valuation Model (AVM) growth for houses, and units.
“AVM allows PropTrack to value every home in Australia every month, rather than just focusing on properties that sell in a given month. This allows us to get a better read on the change in value for a typical home in a suburb,” explained senior economist at the REA Group, Paul Ryan.
Top 10 suburbs for median price growth: Houses
|
Rank |
Suburb | SA4 region | Current median AVM | 6 month % growth in AVM |
|
1 |
Hurlstone Park | Sydney – Inner West | $2,037,000 | 14.4% |
|
2 |
Fairlight | Sydney – Northern Beaches | $3,683,000 |
13.4% |
|
3 |
Smithfield Plains | Adelaide – North | $378,000 | 13.1% |
|
4 |
Kings Langley | Sydney – Blacktown | $1,417,000 | 13.1% |
|
5 |
Biggenden | Queensland – Wide Bay | $309,000 |
13.0% |
|
6 |
Andrews Farm | Adelaide – North | $470,000 |
12.4% |
|
7 |
Elizabeth North | Adelaide – North | $353,000 |
12.3% |
| 8 | Davoren Park | Adelaide – North | $360,000 |
12.3% |
| 9 | Brookdale | Perth – South East | $369,000 |
12.1% |
| 10 | Manly | Sydney – Northern Beaches | $4,667,000 |
12.1% |
Suburbs that have experienced the largest six-month house price growth in AVM. Source: PropTrack.
The growth in Sydney’s real estate market was attributed to two main drivers: a change in consumer confidence and a re-reading of the economic tea leaves.
“I think Sydney has benefited, in particular, from a real change in sentiment in the market this year, compared with last year,” Ryan told The Property Tribune.
“This time last year, I think people were worried about recessions, they were worried about the risks to the global economy, and now we are in a position where we are either at the peak of rates or very close to the peak of rates.”
“Concerns about recession, and similar, have dissipated to some extent.”
Paul Ryan, senior economist, REA Group
Ryan added that many inner city areas are typically purchased by people that have jobs in finance, banking, legal and similar.
An unusual entry to the top ten was Biggenden, Queensland. The suburb recorded the fifth largest growth, at 13%, and was largely dissimilar to other top 10 suburbs: it had the lowest median of any suburb in the top ten, and has a population of just 788 people, according to the Australian Bureau of Statics’ (ABS) 2021 census data.
“We see a huge amount of demand for southeast Queensland and that’s going to spread northward,”
Paul Ryan, senior economist, REA Group
“I think people are discovering that there are many really pleasant suburbs across Queensland and a lot of really reasonably priced parts of Queensland. I think a lot of that post-pandemic demand growth is spreading out and buyers are starting to notice these other locations.”
North Adelaide also recorded strong growth, coming in third, sixth, seventh and eighth, with growth ranging from 12.3% to 13.1%.
Ryan pointed out North Adelaide’s appeal was in its affordability.
“We have seen a lot of those suburbs over there topping the list over the last six months.”
Top 10 suburbs for median price growth: Units
|
Rank |
Suburb | SA4 region | Current median AVM |
6 month % growth in AVM |
|
1 |
Forest Lodge | Sydney – City and Inner South | $ 1,196,000 |
12.7% |
|
2 |
Kirribilli | Sydney – North Sydney and Hornsby | $ 1,884,000 |
12.5% |
|
3 |
Haymarket | Sydney – City and Inner South | $ 1,015,000 |
12.5% |
|
4 |
Palm Cove | Cairns | $ 558,000 |
12.5% |
|
5 |
Christie Downs | Adelaide – South | $ 460,000 |
11.9% |
|
6 |
Millers Point | Sydney – City and Inner South | $ 1,840,000 |
11.8% |
|
7 |
Point Piper | Sydney – Eastern Suburbs | $ 5,609,000 |
11.4% |
|
8 |
Lavender Bay | Sydney – North Sydney and Hornsby | $ 1,395,000 |
11.2% |
|
9 |
Brisbane City | Brisbane Inner City | $ 596,000 |
11.0% |
|
10 |
Newcastle West | Newcastle and Lake Macquarie | $ 796,000 |
11.0% |
Suburbs that have experienced the largest six month unit price growth in AVM. Source: PropTrack.
Sydney managed to take six out of the 10 spots for AVM median unit price growth over 2023, with the best-performing suburb being Forest Lodge.
Cairns made the top 10 for units, with Ryan observing the movement is likely due to pandemic trends, including demand generally spreading northwards, and remote or hybrid work becoming more commonplace.
Growth likely to continue
A growing expectation that interest rates are at or close to their peak, along with confidence in inflation figures, are likely buoying the market.
Other factors are also at play:
“I think things like occupancy rates and the recent price growth, which has remained very solid, suggests that we will continue to see price growth ahead,” said Ryan
“In the short term, I think that these regions are likely to continue to see growth. There is obviously a lot of demand that has pushed these parts of the country up over the past six months. I think after we get out beyond that, we will have to think about the broader macroeconomic concerns.”


