- Australian real estate market surges with 9.4% spike in new listings.
- Spring selling season starts early as 2023 defies last year's slowdown.
- Listings rose across Australia, led by Sydney and Melbourne.
The Australian property market saw new listings leap 9.4% in August, according to the latest Ray White listings report written by Ray White data analyst, William Clark.
This will be music to the ears of many property-buying hopefuls, particularly in view of July’s sauntering pace, but total listing figures are not as rosy. Recent CoreLogic data showed that while new listings rose across winter, total advertised supply levels are still well below last year, across the combined capitals.
Early start to the spring selling season
New listings tend to pick up around spring, while the winter months are typically slower.
However, with the solid uplift in new listings across August, experts have declared that the spring selling season has begun early.
New listings rose again last month

Although new listings petered out in the latter half of 2022, current trends indicate that it will be improbable that 2023 will follow suit.
Indeed, all major cities recorded growth from July, signally how strong this trend was across Australia. Notably, Melbourne and Sydney reported a significant increase in new listings.
The Agency CEO Geoff Lucas told The Property Tribune that listings across the East Coast of Australia were up 22% on last year, with solid momentum in the previous seven days.
“This is in line with our sales growth which is also up 22% on last year and we anticipate that listings growth will continue in the coming months,” he said.
New listings movements for capital cities

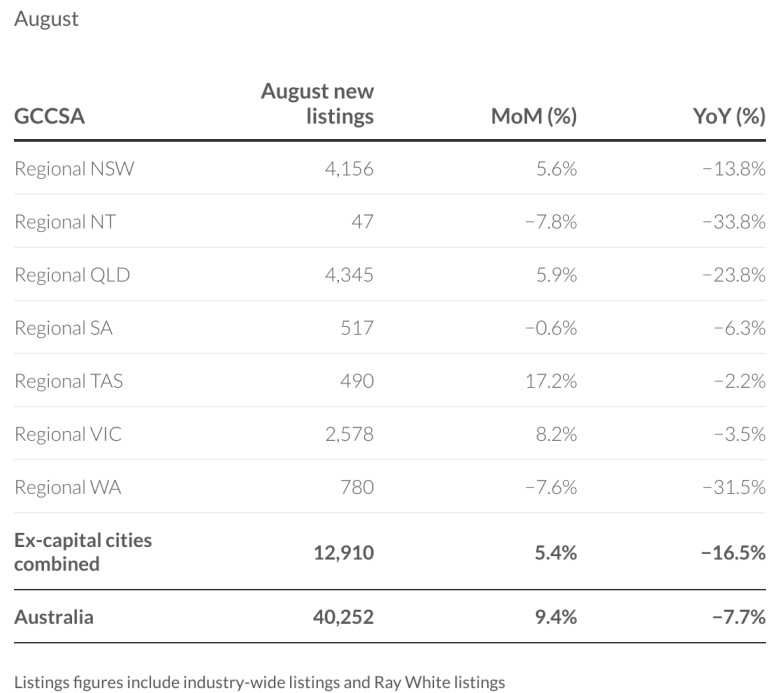
Listings in regional Australia followed the same pattern, having recorded the same surge in new listings. Regional Queensland remained the most dominant non-capital city market, with the Gold Coast bringing in substantial new monthly listings.
However, new listings in regional Australia were still trailing behind the low listings of 2022.
New listings movements for regional Australia
Ray White listing authorities, which refer to the point when vendors have signed a listing but the listing is still not advertised, have been essentially unchanged, as authorities did not rise in August as they did in July.
Authorities are considered a strong lead indicator for future listings, having around a week’s lead before authorities become published listings.
Listing authorities

Sydney listings
Top growth and decline suburbs

Sydney’s new listings rose by 11.6% in August 2023, and 5.4% from July last year.
Tallawong and Colebee were the best-performing suburbs in terms of new listings, with stock spiking by 275% and 233%, respectively.
Pemulwuy had the sharpest decline in stock, with an 88% year-on-year (YoY) drop.
Melbourne listings
Top growth and decline suburbs

New listings in the Victorian capital grew month-on-month (MoM) by 17.2% and 5.8% YoY. While regional listings fell YoY, listings improved compared to July’s numbers.
Travancore and Diggers Rest had a 133% and 100% boost in stock, while Box Hill South had a 58% slump.
Brisbane listings
Top growth and decline suburbs

Listings rose MoM, albeit on a lower scale than the same month last year. Listings in regional Queensland followed the same pattern.
Waterford’s stock shot up by 80%, while St Lucia witnessed a 77% reduction in listings.
Adelaide listings
Top growth and decline suburbs

Like in Brisbane, Adelaide’s stock improved MoM, but trailed behind listings the same month last year.
The top growth suburb for Adelaide was Banksia Park, where listings increased by 200%. On the flip side, the top decline suburb was Aberfoyle Park, where stock contracted by 74%.
Perth listings
Top growth and decline suburbs

While Perth’s new listings rose by 6.8% from July, they remained 3.7% under August last year. Regional listings decreased by 7.6% between May and August, and are down by 31.5% YoY.
Forrestdale was the highest-growth suburb, with a 175% increase in listings, while Midvale followed closely with a 150% surge in new stock. Meanwhile, listings in Waikiki shrank by 70%, the most considerable decline in Perth.
Hobart listings
Top growth and decline suburbs

August was an excellent month for Hobart, which saw stocks rise by 14.8%, Australia’s most significant MoM growth. Nonetheless, the new listings are still depressed by 5.8% compared to August last year.
Battery Point had the most significant rise in listings, with 75% more stock available, while Sandy Bay has 38% fewer homes to purchase.
Darwin listings
Top growth and decline suburbs

Darwin’s new listings grew by 26.5% in August but still lagged behind YoY, with a 30.7% decrease from last year.
New listings increased in the top-performing suburb, Parap, by 25%. Bakewell had the steepest decline in listings, with a 73% fall.
Canberra listings
Top growth and decline suburbs

New listings soared by 31.2% MoM and 11.5% YoY in Canberra.
Harrison led the pack with a 175% YoY jump in listings, while Mawson had the highest decrease of 64%.


