- Every capital city bar Darwin recorded a month-on-month decline in August
- The 1.6% national decline was lead by Sydney which recorded a 2.3% decline
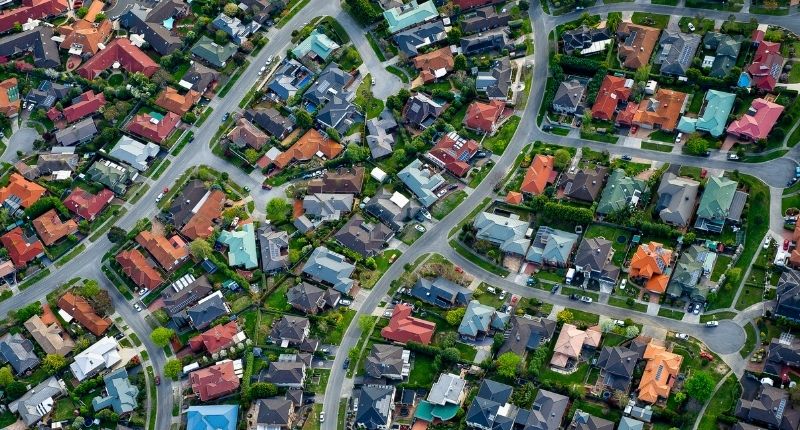
- Most housing markets have house values above pre-Covid levels
New data has confirmed the continuation of the housing downturn, with every capital city apart from Darwin recording a decline in house values over August.
CoreLogic’s House Value Index has recorded the fourth consecutive month of decline in August, with the downturn accelerating and become more broad-based geographically.
The 1.6% decline in August is the largest month-on-month decline since 1983 – the year we won the America’s Cup.
Sydney leads the downswing, with a 2.3% decline over the month. Brisbane, however, saw weaker conditions accelerate with a sharp 1.8% decline.
Tim Lawless, CoreLogic’s research director, said the shift in decline for Brisbane had been acute after almost two years of continuous growth due to relative affordability and high interstate migration.
“It was only two months ago that the Brisbane housing market peaked after recording a 42.7% boom in values. Over the past two months, the market has reversed sharply with values down -1.8% in August after a -0.8% drop in July,” Mr Lawless said.
Regional not immune
With regional areas recording stronger appreciation through the upswing, the data shows that regional welling values are now catching up with the capital cities.
Regional home values declined 1.5% last month, with a 1.6% fall across the combined capitals.
Between March 2020 and January 2022, regional dwelling values saw a 40% increase. By contrast, the combined capitals experienced a 25.5% rise.
“The largest falls in regional home values are emanating from the commutable lifestyle hubs where housing values had surged prior to the recent rate hikes,” Mr Lawless said.
“Over the past three months, values are down -8.0% across the Richmond-Tweed, -4.8% across the Southern Highlands-Shoalhaven market and -4.5% across Queensland’s Sunshine Coast.”
Across the 41 regional SA4 sub-regions analysed by CoreLogic, just seven recorded a rise in housing values during August. These were the northern suburbs of Adelaide (0.9%), Perth’s North East (0.6%), Mandurah (0.5%) and the Coffs Harbour-Grafton region (0.6%).
Most households have significant equity buffer
In spite of this weakness, most housing values still remain above pre-Covid levels.
Home values in capital cities and rest-of-state regions, except Melbourne, are 15% or above the levels witnessed in March 2020. This signifies that most homeowners have a significant equity buffer before their home is to be worth less than what they paid.
“A 15% peak to trough decline would roughly take CoreLogic’s combined capitals index back to March 2021 levels,” Mr Lawless said.
“Additionally, many home owners would have had at least a 10% deposit and paid down a portion of their principal, the risk of widespread negative equity remains low.”
Mr Lawless added that he expects the downturn to continue for the rest of the year, and possibly into 2023.
“It’s hard to see housing prices stabilising until interest rates find a ceiling and consumer sentiment starts to improve,” he said.
“From current levels, interest rates are likely to increase by at least another 75 basis points and there is a good chance advertised stock levels will accumulate through the spring selling season, providing more choice for buyers and adding further downwards pressure on housing values.”
Index results as at 31 August, 2022
| Location | Change in dwelling values | ||||
| Month | Quarter | Annual | Total return | Median value | |
| Sydney | -2.3% | -5.9% | -2.5% | -0.7% | $1,066,493 |
| Melbourne | -1.2% | -3.8% | -2.1% | 0.8% | $782,053 |
| Brisbane | -1.8% | -2.5% | 17.5% | 21.7% | $762,284 |
| Adelaide | -0.1% | 1.6% | 21.8% | 25.7% | $652,959 |
| Perth | -0.2% | 0.4% | 4.9% | 9.4% | $561,781 |
| Hobart | -1.7% | -3.3% | 5.8% | 9.8% | $714,370 |
| Darwin | 0.9% | 2.3% | 6.3% | 12.8% | $512,531 |
| Canberra | -1.7% | -2.6% | 7.8% | 12.0% | $909,748 |
| Combined capitals | -1.6% | -3.8% | 2.2% | 4.8% | $808,287 |
| Combined regional | -1.5% | -2.1% | 13.4% | 17.5% | $594,006 |
| National | -1.6% | -3.4% | 4.7% | 7.5% | $738,321 |
Source – CoreLogic
Advertised housing stock is also on the rise, currently 13.4% higher than a year ago, and 6.5% over the previous five-year average.
“Despite the downwards trend in new listings through the colder months, the total number of capital city homes advertised for sale held reasonably firm, and there are currently 11.3% more homes available for sale compared to this time last year,” Mr Lawless said.
“Sydney and Melbourne, where the housing downturn is more advanced, are already seeing total advertised stock rise to above average levels and there is a good chance the other capitals will follow suit as listings rise through spring and demand continues to taper.”
Mr Lawless noted that that there tends to be a 22% rise in new capital city listings once spring begins, however it might not be as active given some vendors will be dissuaded by the downturn.
“With spring upon us, advertised stock levels are expected to rise. Inventory was already higher than average across some markets at the end of winter (Sydney/Melbourne/Hobart) and, although the flow of new listings may not be as high as previous years, we could see advertised supply accumulating through spring due to a lack of housing demand.
“Amid higher advertised stock levels, vendors will be competing across a larger pool of available supply for fewer buyers. While this is positive news for buyers, sellers will need to be realistic in their pricing expectations and ensure they have a quality marketing campaign in place,” Mr Lawless said.
“At the same time we are expecting to see less buying activity as higher interest rates and low sentiment continue to weigh on demand. Should this scenario play out, the net result will be an accumulation of advertised supply that could further weigh down values.”
What’s next?
The outlook for the housing market remains intertwined with interest rate rises, with another likely to occur next Tuesday.
Mr Lawless said the range of forecasts for the cash rate – from 2.5% to 3.5% – highlight the uncertainty across the financial markets given inflation, wages growth and monetary policy.
“As borrowing power is eroded by higher interest rates and rising household expenses due to inflation, it’s reasonable to expect a further decline in consumer confidence and lower housing demand,” Mr Lawless said.


