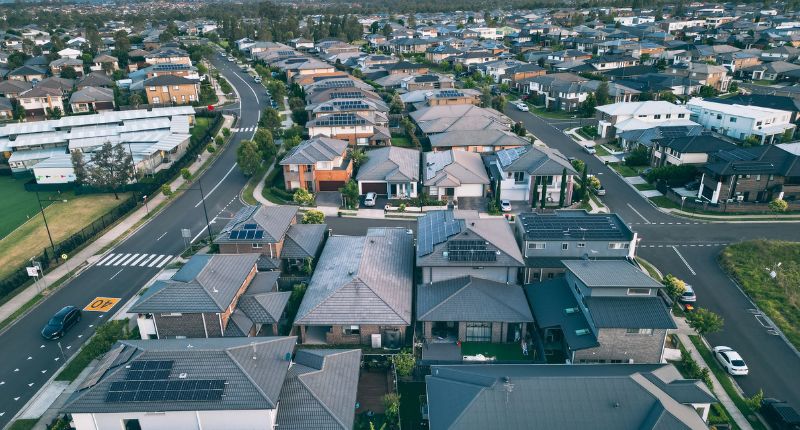
- New listings rose by 21.9% MoM across the capital cities.
- Total listings rose by 8.1% MoM for the capitals.
- Nationally, new listings rose 4.1% YoY.
Australia’s real estate market has seen new listings leap by 20.5% month-on-month (MoM) in August 2023, according to PropTrack’s latest listings report.
This latest rise helped to round out an unseasonably strong winter this year. According to Ray White earlier this year, new listings had already started picking up in July but remained below 2022 levels. An uptick was also observed in PropTrack’s July listings report.
New listings also rose year-on-year (YoY), up 4.1% compared to the same time last year. The report noted it was the first positive YoY change since August 2022.
“After a quieter first half of 2023, property market activity appears to be picking up in Sydney and Melbourne, with both markets busier than typical in August. Activity in many other capitals has also increased but remains subdued compared to a year ago,” said PropTrack senior economist and report author, Angus Moore.
“Activity is likely to continue increasing over the spring selling season, reaching the typical peak in October and November.”
Angus Moore, PropTrack
“Selling conditions and home prices have also improved compared to late 2022. Home prices nationally have continued to recover, posting their eighth consecutive month of growth in August. Home prices nationally are now just 0.8% below the March 2022 peak.”
“Auction clearance rates remained solid through winter and have improved from the levels recorded in late 2022.”
The auction market also recorded boosts to the number of homes heading under the hammer in winter, with the out-of-season trend noted by CoreLogic across some weekends.
Change in new and total for sale listings on realestate.com.au August 2023
| Region | Area | New listings | Total listings | ||
| MoM% | YoY% | MoM% | YoY% | ||
| NSW | Sydney | 25.7% | 18.4% | 10.1% | -5.8% |
| Regional NSW | 19.2% | -0.7% | 3.0% | 15.8% | |
| VIC | Melbourne | 24.9% | 20.8% | 9.4% | 6.6% |
| Regional Victoria | 14.9% | 8.1% | 3.9% | 37.8% | |
| QLD | Brisbane | 11.8% | -10.4% | 5.8% | -14.1% |
| Regional Queensland | 15.5% | -9.6% | 2.6% | -9.7% | |
| SA | Adelaide | 18.9% | -3.3% | 7.9% | -4.2% |
| Regional South Australia | 26.1% | 7.3% | 4.7% | 5.6% | |
| WA | Perth | 17.9% | -8.6% | 4.0% | -22.4% |
| Regional Western Australia | 18.9% | -8.9% | 2.7% | -12.1% | |
| TAS | Hobart | 13.8% | -1.8% | 3.4% | 32.0% |
| Regional Tasmania | 41.3% | 8.3% | 3.4% | 35.6% | |
| NT | Darwin | 24.1% | -5.4% | 3.4% | 4.9% |
| Regional Northern Territories | 25.4% | 13.5% | 3.5% | 9.3% | |
| ACT | Canberra | 38.9% | 23.2% | 15.4% | 13.1% |
| National | Capital cities | 21.9% | 8.0% | 8.1% | -5.1% |
| Regional areas | 18.0% | -2.2% | 3.1% | 7.6% | |
| Total | 20.5% | 4.1% | 5.7% | 0.5% | |
Source: PropTrack.
Sydney and Melbourne record busy winters
The busiest winters in more than a decade were recorded in Sydney and Melbourne. New listings rose by 18.4% in Sydney, while Melbourne recorded a 20.8% surge on the same time last year.
Strong winters for the big smoke helped to push the YoY growth across the capitals to eight per cent, with the MoM growth coming in at 21.9% for the combined capitals.
The regions also saw a MoM activity spike, however, YoY activity was more subdued at -2.2%.
Elevated levels of listings also helped to boost the previously subdued levels of total listings, now up 5.7% MoM.
Cash rate stable and fundamentals strong
While the uptick in activity may somewhat be expected as we head into spring, the broader economic picture is also getting a little more rosy.
“The cash rate has remained steady at 4.1% for three consecutive months. While there may still be further interest rate increases, markets are pricing in only a small probability of that occurring. Inflation appears to be heading back towards target at a pace consistent with the Reserve Bank’s expectations,” said Moore.
“Further out, the fundamentals of housing demand remain strong. Unemployment remains very low by historic standards, though it has edged higher recently. Rental markets remain extremely tight across much of the country, and rents are growing quickly amid strong demand and limited rental availability. International migration and population growth are forecast to remain strong, which will further add to housing demand.”


