- Australian cities were in both top and bottom for price changes
- New Zealand led the world for residential price declines
- Turkey saw prices soar
The Australian property market has seen a downturn over the past few months, with prices across most Australian cities falling.
House prices in Sydney were shockingly high and now the city is seeing one of the largest declines across the country. Melbourne prices have also seen dips, but strongholds like South East Queensland, Adelaide, and Perth are holding value, if not continuing price growth.
Property in Australia experienced some incredible levels of growth since the pandemic began, with houses available for sale at record lows, and rental stock also dwindling.
Top 10 house price declines in the world includes Sydney, Darwin, and Melbourne
According to Knight Frank’s Global Residential Cities Index Q3 2022*, the top ten price declines occurred across New Zealand, China, Australia, Europe, and South America.
- Wellington, down 17.3%
- Auckland, down 11.2%
- Buenos Aires, down 9.8%
- Hong Kong, down 7.1%
- Wuhan, down 6.1%
- Tianjin, down 4.4%
- Zhengzhou, down 3.9%
- Sydney, down 3.6%
- Darwin, down 3.1%
- Aberdeen, down 2.4%
Adelaide makes global top 10 for residential price increase
Australia’s property markets can be found everywhere on the 150 city list.
Sydney was ranked 143rd in the world, recording a 3.6% decline in prices, according to the report. Darwin was next at 142nd, with a 3.1% decline. Melbourne was just outside of the bottom ten, at 139th with a price fall of 2.1%.
Canberra sits further away from the bottom at 104th place, recording a price increase of 4%, followed by Perth at 77th place, recording a price increase of 6.3%.
Hobart made 59th place with a house price increase of 7.9% and Brisbane had an increase of 12.9% putting it at 30th. Adelaide made top ten in the world at eighth place with a house price rise of 21.3%.
World’s top ten cities for house price rises
House prices skyrocketed, with the top three cities seeing shocking price surges of over 100%**. While the top three cities were all in Turkey, the remainder were scattered across Florida, South Australia, the Middle East, northeastern Europe, and Iceland.
- Istanbul, up 212.1%
- Ankara, up 196%
- Izmir, up 185.8%
- Miami, up 28.6%
- Riyadh, up 25%
- Vilnius, up 25%
- Tallinn, up 23%
- Adelaide, up 21.3%
- Skopje, up 21.2%
- Reykjavik, up 20.7%
World city comparison
Did global hubs like New York and London beat Australia to the top or bottom? A bit of both.
For context, Asian capitals like Kuala Lumpur featured at 138th with a price decline of 1.2%. Jakarta had a price rise of 1.7% but that only took the Indonesian capital to 121st place on the list.
Seoul had a price rise of 2.3%, putting the Korean capital at 118th. Paris came in at 117th with a price rise of 2.4%, with financial centre Shanghai ranking 106th with a 3.8% price rise.
Vancouver was 105th with a 3.9% price rise, close to Canberra, and Toronto was 101st with a 4.5% house price rise. Taipei came in at 91st with a 5.6% price rise, and Middle Eastern city Abu Dhabi saw house prices rise 5.8%, putting the city at 87th. The city’s northern neighbour, Dubai, featured at 27th with a 13.2% price rise.
Frankfurt was 75th, close to Perth, with a price rise of 6.5%. Britain’s capital, London, ranked 70th, with houses in the capital of the UK rising 6.8%. Delhi saw prices rise 7.8% and Osaka 7.9% putting them just behind Hobart at 61st and 60th respectively.
New York homes saw prices rise 12.4%, putting the Big Apple at 32nd, behind Brisbane at 30th. Los Angeles and San Diego also ranked behind Brisbane, at 33rd and 31st respectively.
Singapore ranked 26th place with a price rise of 13.6%.
The report found that interest rates, inflation, and more had made an impact on housing markets.
Knight Frank’s report also noted a small decline in the number of cities recording annual price growth, last quarter it was 138 cities, and this quarter it was 133.
Urban house prices more resilient than national markets in Q3

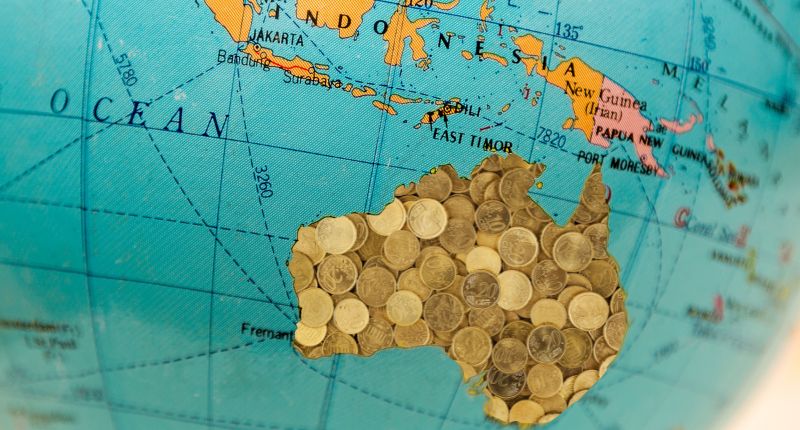
How much do Australian houses cost?
According to SQM Research, the national weekly asking property price is almost $830,000 at the moment. Around December 2021 it was around $750,000 to $760,000, and during the first year of Covid, house prices across the nation were around $630,000. Pre-covid, house prices in Australia were around $580,000.
The capital city average is about $400,000 more at over $1.2 million. It should come as no surprise, with major east coast cities like Sydney and Melbourne pulling prices up drastically. Strength in the Queensland market of Brisbane, and other strong performers have added to the price rises.
In December last year, capital city average was around the same as today, with 2020 seeing prices at around the $1 million mark. Pre-covid the average house price across the capitals was some $960,000, with a 2018 low of $930,000. The 2017 peak was on par with the 2019 price of $960,000.
Expensive Australian houses
Adelaide’s most expensive houses are around the $6 million mark, loose change by Sydney and Melbourne standards, and indeed by global standards for cities like London and New York.
Perth’s most expensive homes managed to fetch in the tens of millions, with some prime waterfront homes taking the cake.
Brisbane was much the same, but with the market raging hot, it shouldn’t be surprising to see some homes break records in the near future.
Sydney’s most expensive homes fetched well into the hundreds of millions, from apartments to harbourside mansions, featuring uninterrupted and sweeping views of Sydney’s famous icons like the Sydney Harbour Bridge, and Sydney Opera House.
Melbourne’s most expensive homes weren’t far behind either.
~~
* The rankings are by annual percentage change between Q3 2021 and Q3 2022. The rankings track average residential prices. The index tracks nominal prices in local currencies. The report noted some data is from Q2 2022.
** Knight Frank also has the Global House Price Index which has real price growth adjusted for inflation. Despite that, Turkey remains at the top with the adjusted figure an annual percentage change of 57.6%, well above all other cities.


